If you operate an MBR system, membrane fouling is your biggest challenge. It reduces efficiency and increases costs.
Membrane fouling in MBR systems occurs when particles, microorganisms, and dissolved substances accumulate on membrane surfaces. This blocks pores and reduces filtration performance. Understanding fouling types and implementing proper cleaning protocols maintains system efficiency and extends membrane life.
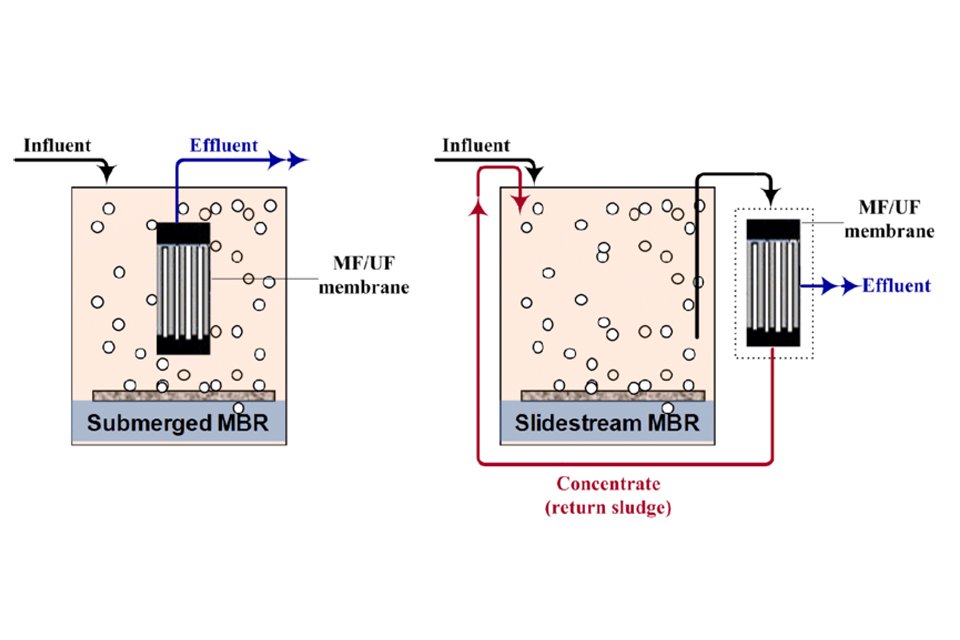
I've seen countless operators struggle with fouling issues. The good news is that with the right knowledge and approach, you can manage fouling effectively. Let me walk you through everything you need to know.
What Are the Four Main Types of Membrane Fouling?
Membrane fouling doesn't happen randomly. Different substances cause different problems. Each type needs a specific approach.
The four main types are biofouling (bacterial growth), organic fouling (proteins and oils), inorganic scaling (mineral deposits), and pore blocking (physical obstruction). Each type requires different prevention strategies and cleaning chemicals to restore membrane performance effectively.
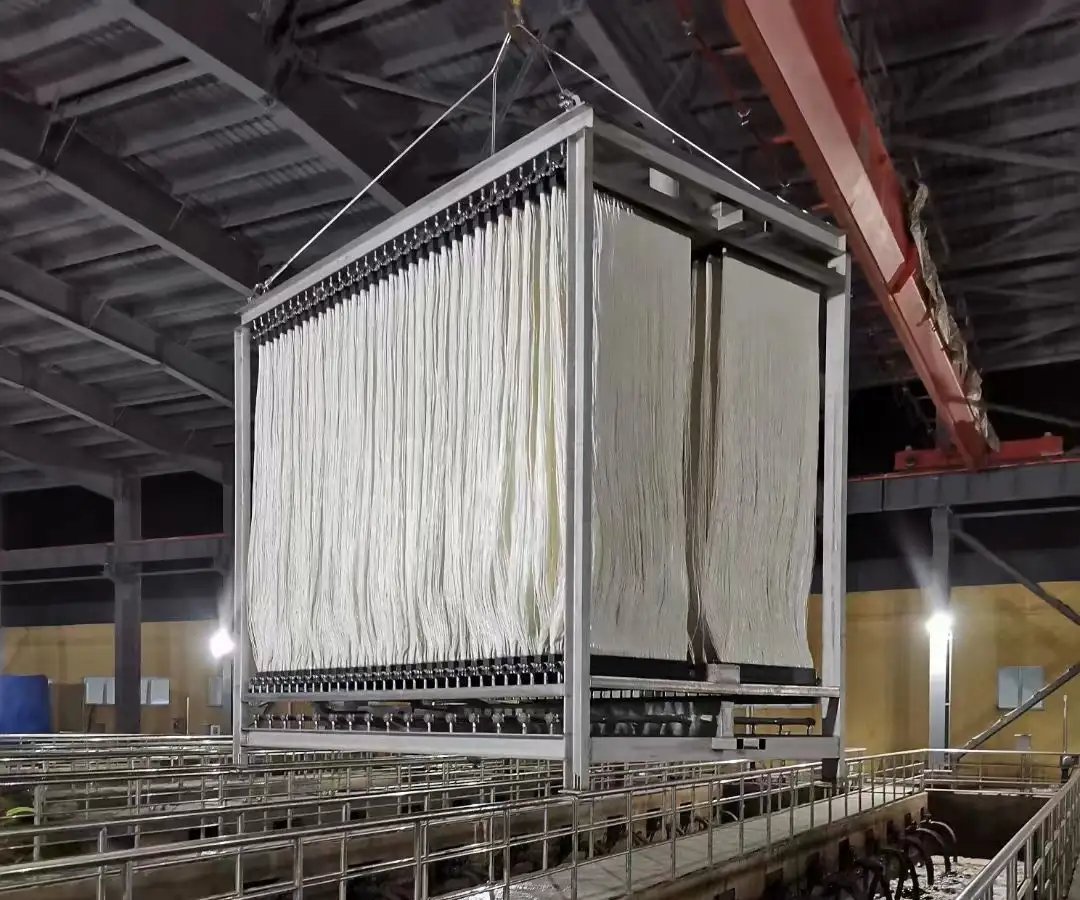
Understanding these fouling mechanisms changed how I approach system maintenance. Biofouling happens when bacteria form biofilms on membrane surfaces. These sticky layers trap other particles and create a cascade effect. Organic fouling occurs when proteins, oils, and other organic molecules adhere to membranes. This type is common in food processing wastewater.
Inorganic scaling develops when dissolved minerals precipitate onto membranes. Calcium carbonate and iron oxides are typical culprits. Pore blocking is physical obstruction where particles smaller than membrane pores get trapped inside. Each fouling type shows different symptoms and responds to specific treatments.
| Fouling Type | Primary Cause | Common Symptoms | Cleaning Method |
|---|---|---|---|
| Biofouling | Bacterial growth | Gradual TMP increase | Chlorine-based cleaners |
| Organic fouling | Proteins, oils | Rapid flux decline | Alkaline cleaners |
| Inorganic scaling | Mineral deposits | Steady pressure rise | Acidic cleaners |
| Pore blocking | Fine particles | Sudden performance drop | Physical cleaning |
The key is early identification. When I work with clients, I teach them to monitor these patterns. Early detection saves time and money. It also prevents irreversible membrane damage.
How Can You Prevent Fouling Before It Starts?
Prevention beats treatment every time. Smart operational practices reduce fouling by up to 70%. Small changes make big differences.
Effective fouling prevention includes optimizing aeration intensity, maintaining proper flux rates, implementing regular relaxation cycles, and controlling feed water quality. These proactive measures reduce fouling formation and extend cleaning intervals significantly.
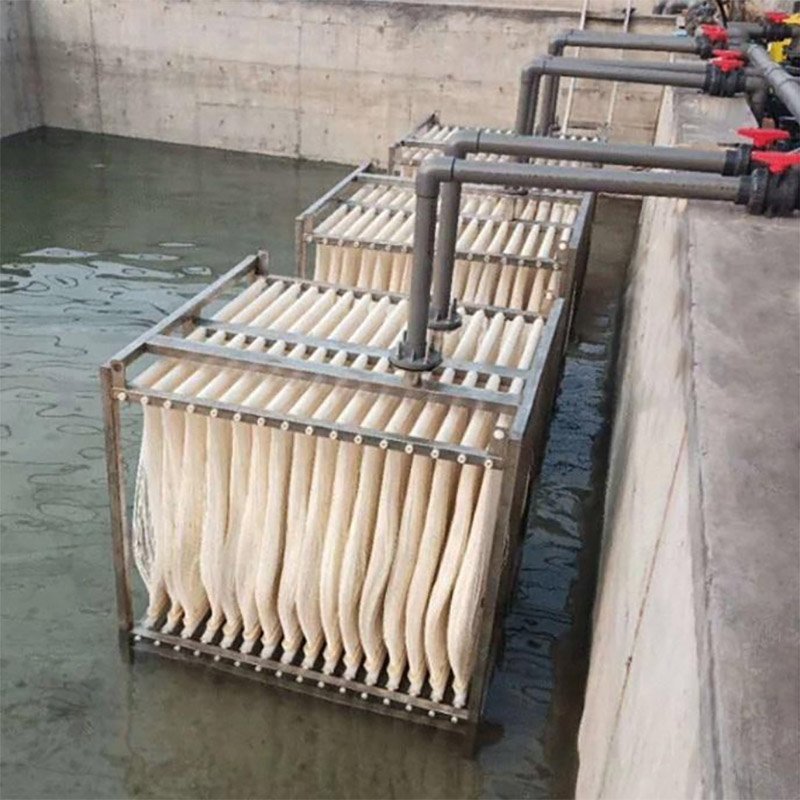
Aeration management is your first line of defense. Proper air flow creates turbulence that scours membrane surfaces. I recommend maintaining air flow rates between 8-12 m³/h per square meter of membrane area. Too little air allows fouling accumulation. Too much wastes energy and can damage membranes.
Flux rate control is equally important. Operating below critical flux reduces fouling propensity. Critical flux is the threshold where fouling formation accelerates dramatically. Most MBR systems perform best at 15-25 liters per square meter per hour. Higher flux rates might seem attractive for capacity, but they increase fouling exponentially.
Relaxation cycles give membranes breathing room. During relaxation, permeate flow stops while aeration continues. This allows loosely attached foulants to detach naturally. I typically recommend 2-10 minute relaxation periods every 10 minutes of operation. The exact timing depends on feed water characteristics and fouling tendency.
Feed water pretreatment removes fouling precursors before they reach membranes. Screening removes large particles. Oil separators eliminate free oils. pH adjustment prevents precipitation. These simple steps dramatically improve membrane performance and longevity.
What Are the Best Chemical Cleaning Protocols?
Chemical cleaning restores membrane performance when fouling occurs. The right chemicals and procedures make all the difference. Wrong choices can damage membranes permanently.
Effective cleaning uses maintenance cleans with sodium hypochlorite for routine biofouling control and recovery cleans with citric acid for heavy scaling removal. Proper chemical selection, concentration, temperature, and contact time ensure thorough cleaning without membrane damage.
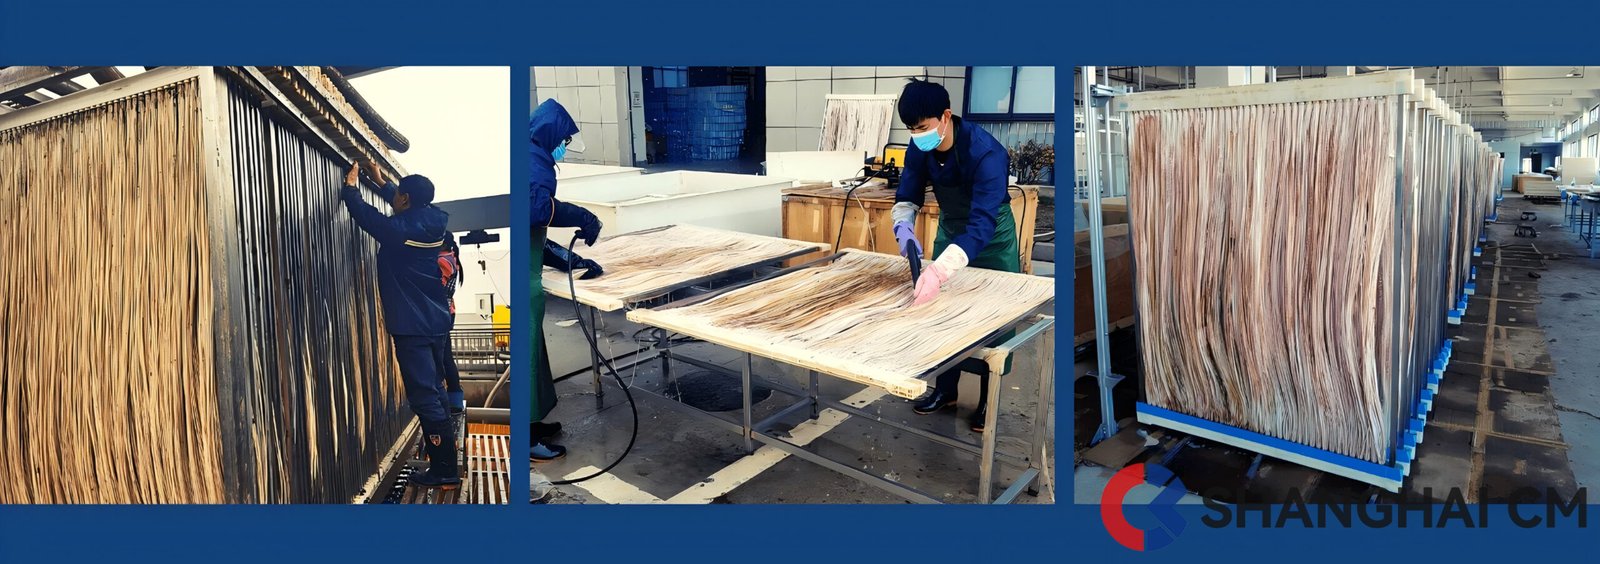
Maintenance cleaning happens regularly to prevent fouling buildup. I recommend weekly maintenance cleans using 200-500 ppm sodium hypochlorite. This concentration kills bacteria and breaks down biofilms without harming membranes. Cleaning duration should be 30-60 minutes with gentle recirculation.
Recovery cleaning tackles severe fouling when maintenance cleaning isn't enough. For organic fouling, use alkaline cleaners like sodium hydroxide at pH 11-12. These chemicals dissolve proteins and oils effectively. For inorganic scaling, acidic cleaners work best. Citric acid at 2-3% concentration removes calcium carbonate and iron deposits safely.
Temperature affects cleaning efficiency significantly. Room temperature works for maintenance cleaning. Recovery cleaning works better at 30-40°C. Higher temperatures increase chemical activity but can damage some membrane materials. Always check manufacturer specifications.
Safety considerations are critical. Chlorine gas can form when hypochlorite mixes with acids. Never mix different cleaning chemicals. Use proper ventilation and personal protective equipment. Emergency eyewash stations should be nearby. I've seen accidents happen when operators take shortcuts with safety.
| Cleaning Type | Chemical | Concentration | Temperature | Duration | Frequency |
|---|---|---|---|---|---|
| Maintenance | NaOCl | 200-500 ppm | Ambient | 30-60 min | Weekly |
| Organic recovery | NaOH | pH 11-12 | 30-40°C | 2-4 hours | As needed |
| Inorganic recovery | Citric acid | 2-3% | 30-40°C | 2-4 hours | As needed |
The cleaning sequence matters too. Start with alkaline cleaning for organic fouling, then follow with acidic cleaning for scaling. This two-step approach handles mixed fouling effectively.
How Do You Monitor and Diagnose Fouling Early?
Early detection prevents small problems from becoming big ones. The right monitoring approach saves time and money. Data tells the story before your eyes can see it.
Transmembrane pressure (TMP) monitoring is the primary diagnostic tool for fouling detection. Rising TMP indicates increasing resistance from fouling layers. Combining TMP data with flux measurements, cleaning frequency tracking, and visual inspections provides comprehensive fouling assessment.
TMP measurement is your most important diagnostic tool. Clean membranes operate at low TMP, typically 10-50 mbar. As fouling develops, TMP rises to maintain the same flux rate. I consider 80-100 mbar the action threshold for cleaning. Beyond 120 mbar, fouling becomes difficult to remove completely.
TMP trends reveal fouling patterns. Gradual increases over weeks suggest biofouling. Rapid TMP jumps in hours indicate organic fouling or pore blocking. Steady climbing suggests inorganic scaling. Understanding these patterns helps you choose the right cleaning approach.
Flux decline is another key indicator. When TMP reaches maximum levels, flux starts dropping instead. This means membranes can't maintain design flow rates. Productivity suffers and treatment capacity decreases. Early intervention prevents this stage.
Cleaning frequency tracking shows system trends over time. New systems might clean monthly. As membranes age or feed water changes, cleaning frequency increases. If you're cleaning weekly, something needs attention. Either operational conditions need adjustment or membrane replacement is approaching.
Visual inspection reveals surface fouling conditions. Brown coloration suggests biofouling. White deposits indicate scaling. Oily films show organic fouling. Physical damage like tears or holes requires immediate attention. I recommend monthly visual inspections during routine maintenance.
Data logging systems automate monitoring and provide trend analysis. Modern systems track TMP, flux, temperature, and chemical usage automatically. Alarms notify operators when parameters exceed set points. Historical data helps optimize cleaning schedules and predict membrane replacement timing.
Conclusion
Membrane fouling management requires understanding fouling types, implementing prevention strategies, using proper cleaning protocols, and maintaining effective monitoring systems for optimal MBR performance.


