You face a tough choice. Your wastewater treatment plant needs upgrading, but MBR systems cost 30-50% more upfront than conventional activated sludge systems.
MBR systems typically offer better long-term value despite higher initial costs. When you factor in operational savings, smaller footprint benefits, and revenue from water reuse, MBR's total cost of ownership often beats conventional systems over 15-20 years.
I learned this lesson the hard way when I first started in water treatment. A client chose the cheaper conventional system to save money upfront. Five years later, they called me back because their operating costs were eating their budget alive.
Why Does Initial Investment Tell Only Half the Story?
Most decision-makers focus on capital expenditure first. This creates tunnel vision that misses the bigger financial picture.
Total cost of ownership includes both CAPEX and OPEX over the system's entire lifespan. OPEX often represents 60-70% of total costs over 20 years, making initial savings misleading without operational analysis.
CAPEX Breakdown: Where Your Money Goes
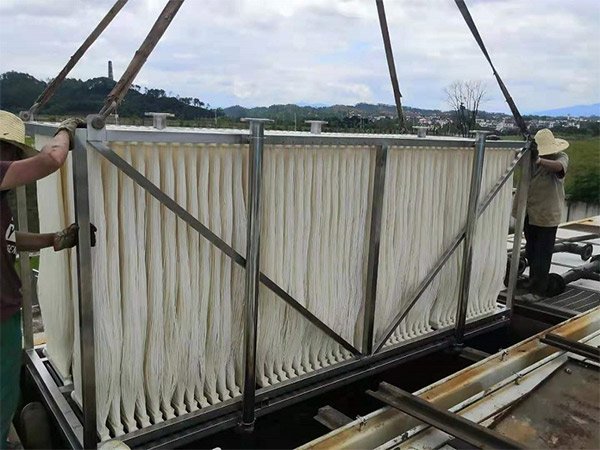
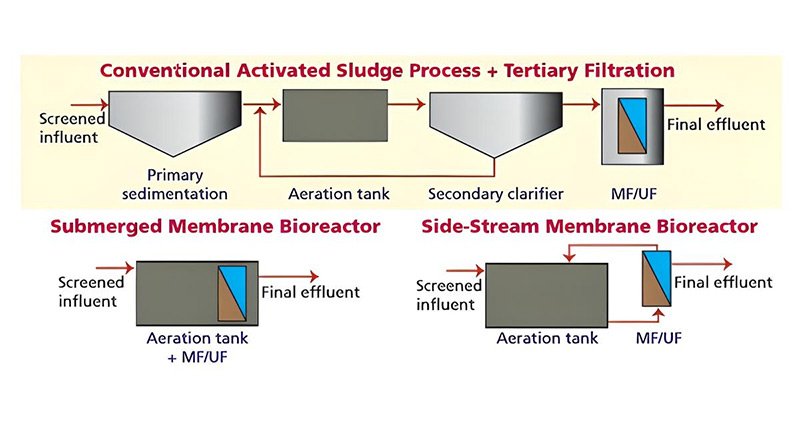
The upfront investment differences become clear when you break down the components. MBR systems need expensive membrane modules, but they require much smaller tanks and eliminates secondary clarifiers entirely. Conventional systems need massive clarifier tanks and extensive piping networks.
Here's what I see in typical projects:
| Cost Component | MBR System | Conventional System | Notes |
|---|---|---|---|
| Membrane Modules | $200,000-400,000 | $0 | MBR only |
| Bioreactor Tanks | $300,000-500,000 | $600,000-900,000 | MBR needs 50% less volume |
| Secondary Clarifiers | $0 | $400,000-800,000 | Conventional only |
| Land Purchase | $100,000-200,000 | $300,000-600,000 | MBR footprint 30-50% smaller |
| Total CAPEX | $600,000-1,100,000 | $1,300,000-2,300,000 | Varies by capacity |
The land savings alone can offset much of MBR's membrane costs, especially in urban areas where land costs $50-100 per square foot.
How Do Operating Costs Change Your Financial Picture?
Daily operating expenses determine whether your investment pays off long-term. Many plant managers underestimate these ongoing costs.
MBR systems typically consume 20-30% more energy than conventional systems but save significantly on sludge disposal, chemical costs, and labor requirements. Net operational savings average $50,000-100,000 annually for mid-sized plants.
Energy Consumption Reality Check
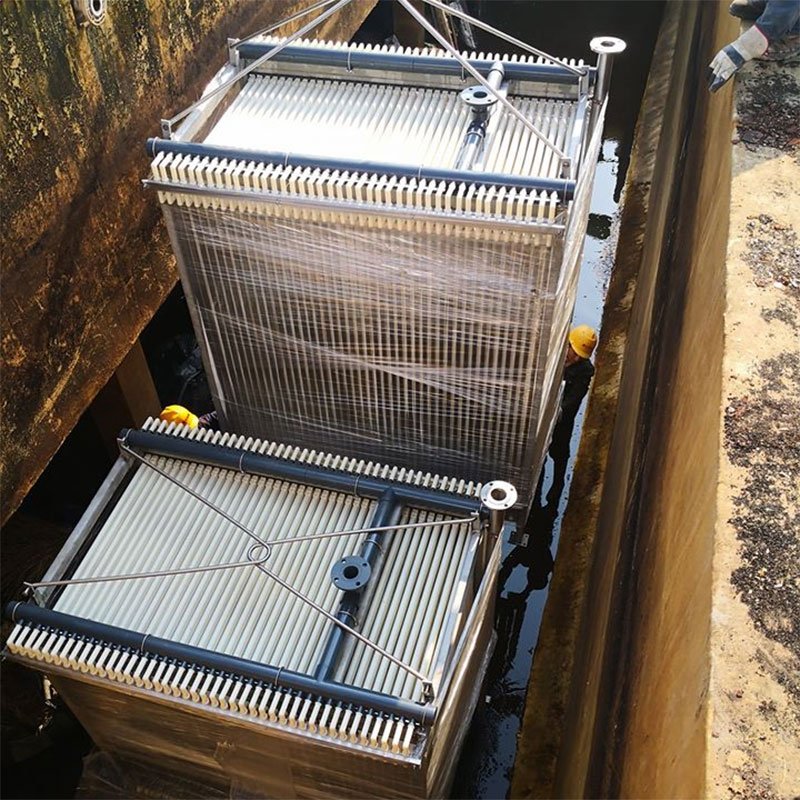
MBR membranes need constant air scouring to prevent fouling. This increases your electricity bill by $30,000-60,000 per year for a 5 MGD plant. However, MBR systems eliminate secondary clarifier operations and reduce pumping requirements due to their smaller footprint.
I track energy costs closely across multiple projects. MBR plants average 0.35-0.45 kWh per thousand gallons treated, while conventional plants use 0.25-0.35 kWh. The difference narrows when you account for avoided clarifier mixing and return sludge pumping.
Chemical Cost Savings Add Up
MBR systems need fewer chemicals because the membrane barrier removes contaminants mechanically. You eliminate polymer addition for clarification and reduce chlorine usage since MBR effluent has lower pathogen counts.
Annual chemical savings typically range from $15,000-30,000 for mid-sized plants. Polymer costs alone can reach $20,000-40,000 yearly in conventional systems.
Sludge Disposal: The Hidden Cost Killer
Conventional systems produce 20-30% more excess sludge than MBR systems. Sludge disposal costs $200-400 per dry ton, making this difference substantial. A 5 MGD plant might save $25,000-50,000 annually on sludge hauling and disposal fees.
What Revenue Opportunities Offset MBR Costs?
Smart operators turn MBR's high-quality effluent into revenue streams. This changes the financial equation completely.
MBR effluent meets reuse standards without additional treatment, creating revenue opportunities worth $100,000-500,000 annually through industrial sales, irrigation contracts, or groundwater recharge credits.
Industrial Water Sales
Manufacturing facilities pay $2-5 per thousand gallons for process water that meets their quality standards. MBR effluent often exceeds these requirements without additional treatment. A 5 MGD plant selling 50% of its effluent for industrial use generates $180,000-450,000 in annual revenue.
I helped one client negotiate a 10-year contract with a nearby manufacturing plant. They sell 2 MGD of MBR effluent at $3.50 per thousand gallons, generating $255,000 yearly. This revenue alone pays for their membrane replacement costs.
Agricultural and Landscape Irrigation
Golf courses, parks, and farms pay premium prices for reliable, high-quality irrigation water. MBR effluent eliminates their concerns about pathogens and suspended solids. Irrigation contracts typically range from $1-3 per thousand gallons depending on local water scarcity.
Groundwater Recharge Credits
Some regions offer financial incentives for groundwater recharge using recycled water. These programs pay $500-2000 per acre-foot of recharged water. MBR systems qualify for these programs without additional treatment, while conventional effluent needs extensive polishing.
How Do You Calculate Your ROI Timeline?
Return on investment depends on your specific situation, but I use a standard framework to compare options fairly.
Most MBR systems achieve positive ROI within 8-12 years when you include operational savings and revenue generation. Projects with high land costs or reuse opportunities often break even in 5-7 years.
My TCO Analysis Framework
I evaluate every project using this five-step process:
Step 1: Calculate True CAPEX Differences
Include land costs, permitting differences, and construction complexity. MBR's smaller footprint reduces excavation, concrete, and electrical infrastructure costs.
Step 2: Project 20-Year OPEX
Factor in energy inflation (3-5% annually), chemical cost increases, and labor rate growth. Don't forget membrane replacement cycles every 7-10 years.
Step 3: Quantify Revenue Potential
Research local water reuse markets, industrial demand, and regulatory incentives. Conservative estimates prevent disappointment later.
Step 4: Apply Your Discount Rate
Use your organization's standard rate (typically 6-8% for municipal projects) to calculate net present value of future cash flows.
Step 5: Sensitivity Analysis
Test different scenarios for energy costs, membrane life, and revenue assumptions. This reveals your project's financial risks.
Your Financial Decision Framework
The numbers tell the story, but every situation has unique factors that change the equation. Start with your specific constraints and opportunities before choosing between MBR and conventional systems.


