
An industrial RO system can cost tens of thousands or several million dollars. Capacity alone does not explain that difference.
Feedwater quality, treatment goals, materials, automation, and site conditions all influence your final investment. Operating choices can also outweigh the initial equipment price.
This guide separates equipment, installation, and operating expenses for clearer budgeting. It also shows how to compare supplier quotations on equal terms.
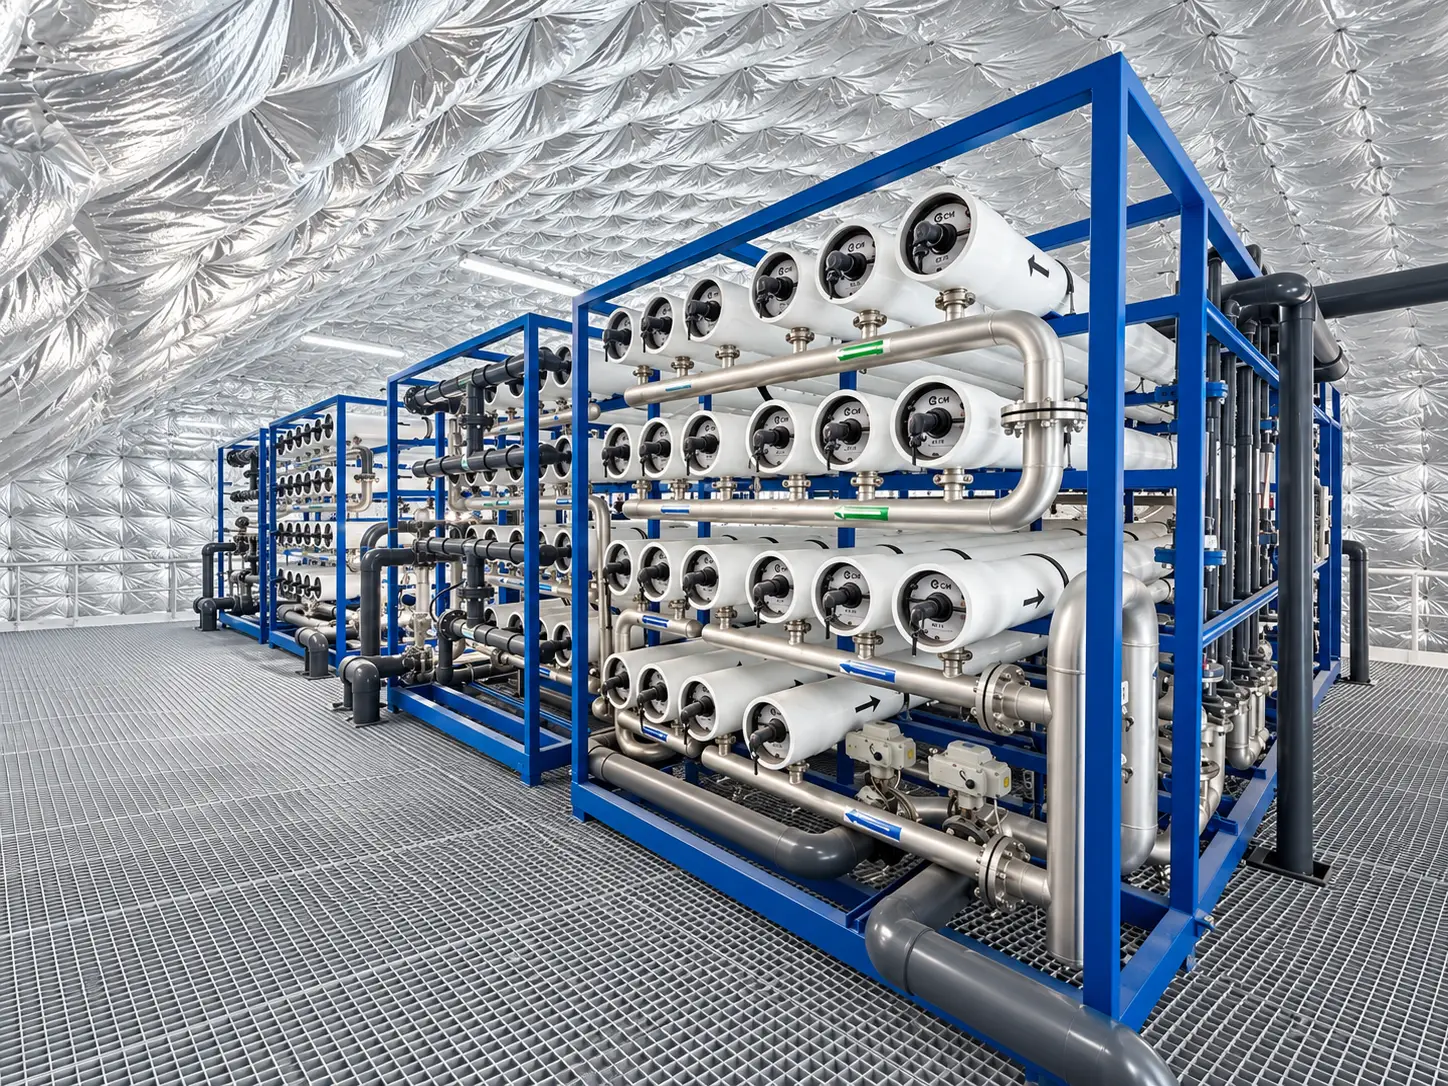
How Much Does an Industrial RO System Cost?
Published market examples provide useful reference points, but they are not firm quotations. Your project requires water analysis and a defined operating basis.
A small 5–10 GPM commercial system may cost about USD 3,000 – 20,000 with common ancillary equipment. Higher industrial specifications can double or triple that amount.
A 30–50 GPM commercial system may approach USD 30,000–100,000.
A 100-400 GPM system may range from roughly USD USD 100,000–500,000.
| Nominal permeate capacity | Published equipment reference | Typical reason for variation |
|---|---|---|
| 5–10 GPM, or 1–2 m³/h | USD 3,000–20,000 | Ancillary tanks, pumps, and industrial specifications |
| 30–50 GPM, or 6–10 m³/h | USD 30,000–100,000 | Pretreatment, controls, materials, and redundancy |
| 100-400 GPM, or 20-100 m³/h | USD 100,000–500,000 | Commercial build versus high-end stainless construction |
Use these values only for early screening. Currency, location, freight, duties, and specification changes can quickly move the budget.
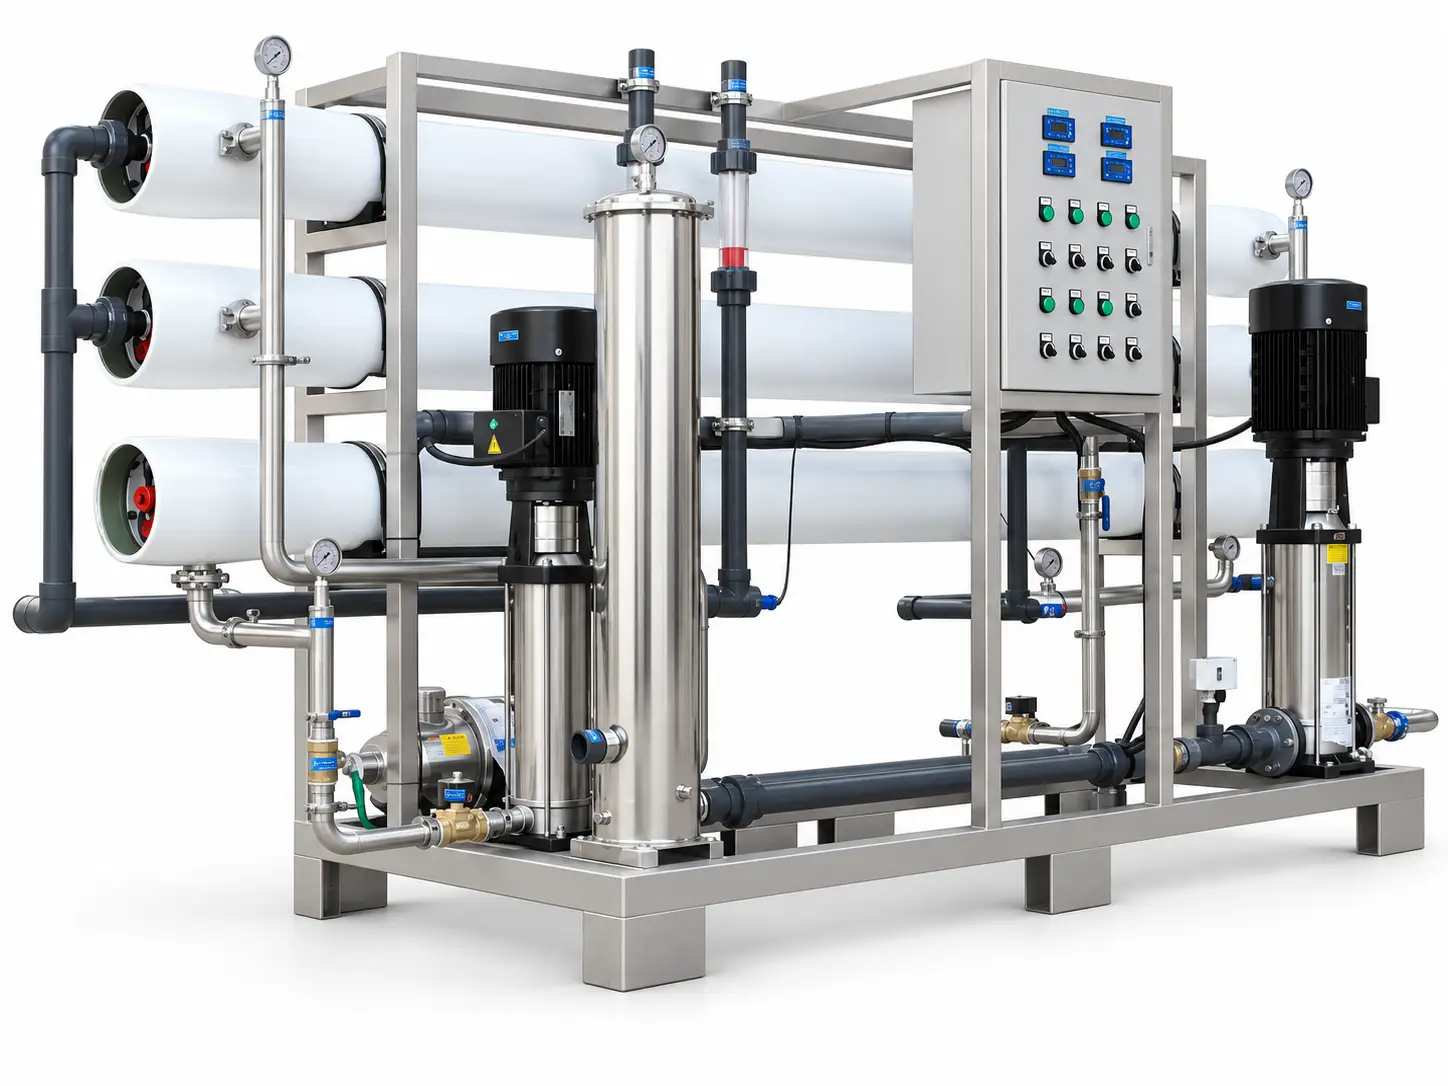
Define the Cost Boundary Before Comparing Prices
Two suppliers can quote the same capacity while covering very different scopes. One price may include only the membrane skid.
Another price may include pretreatment, tanks, controls, installation, and commissioning. Comparing totals without checking scope creates a false saving.
We recommend dividing every proposal into three cost groups. This structure reveals scope differences before you compare totals.
- Equipment and packaged process systems
- Installation, engineering, and site integration
- Annual operation and maintenance
The EPA RO/NF cost model uses a similar component-based approach. It separates membrane racks from pumps, instruments, cleaning, pretreatment, and residuals management.
That separation helps you identify missing items before contract award. It also supports a more defensible total cost of ownership calculation.
Industrial RO Equipment Cost
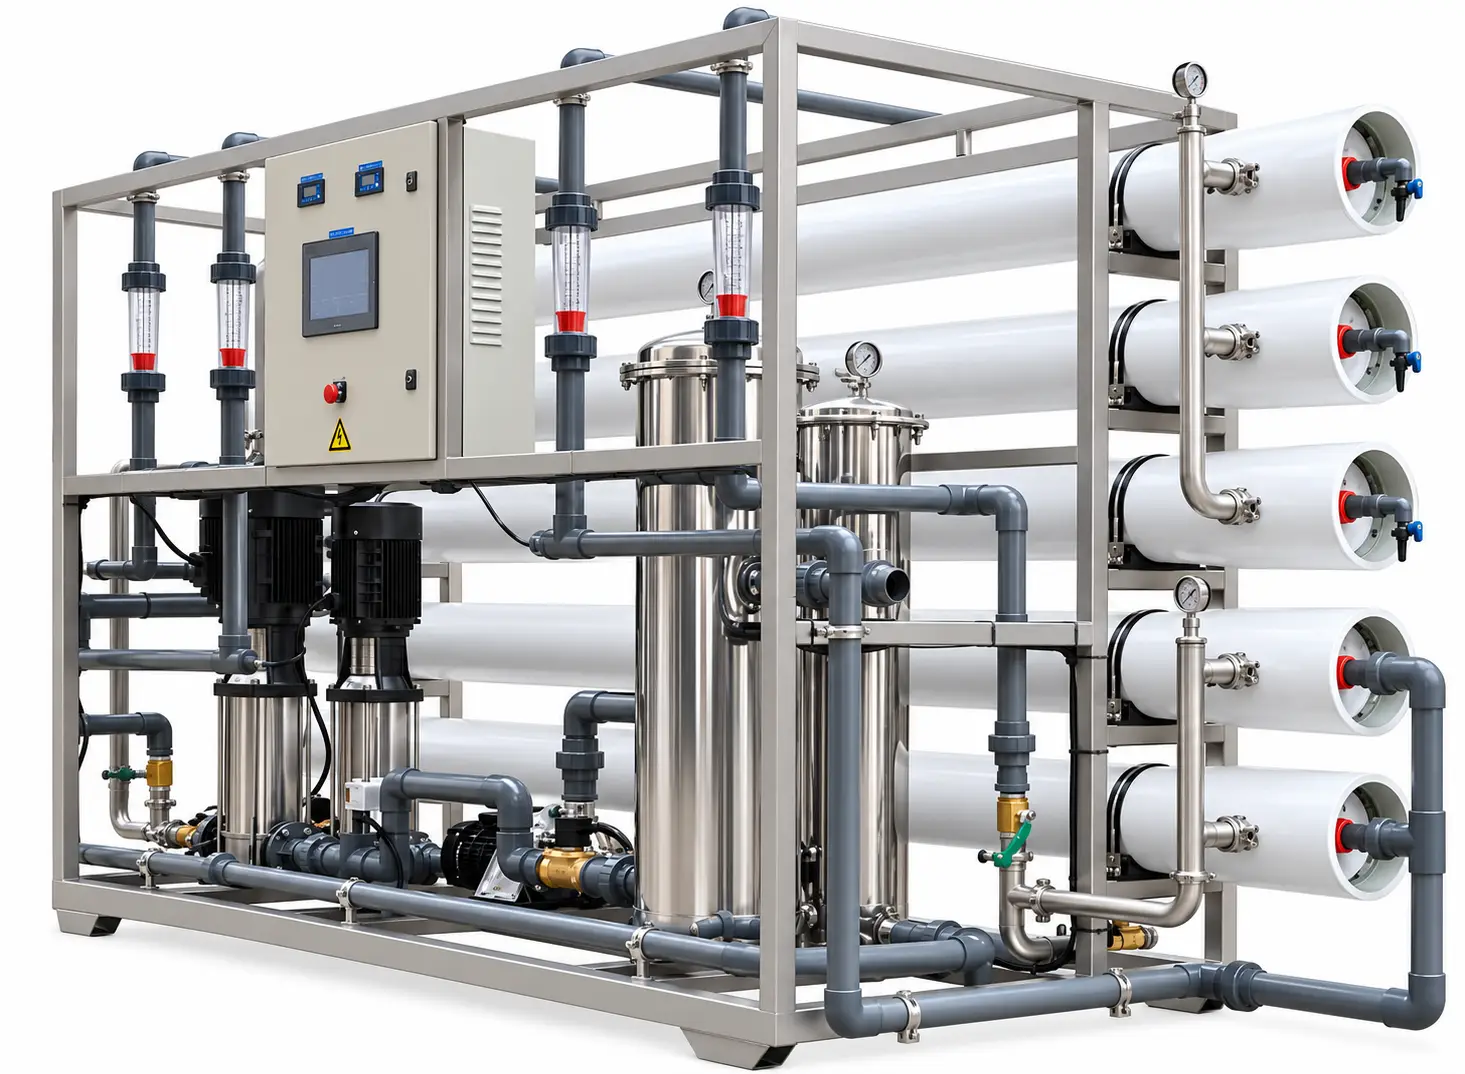
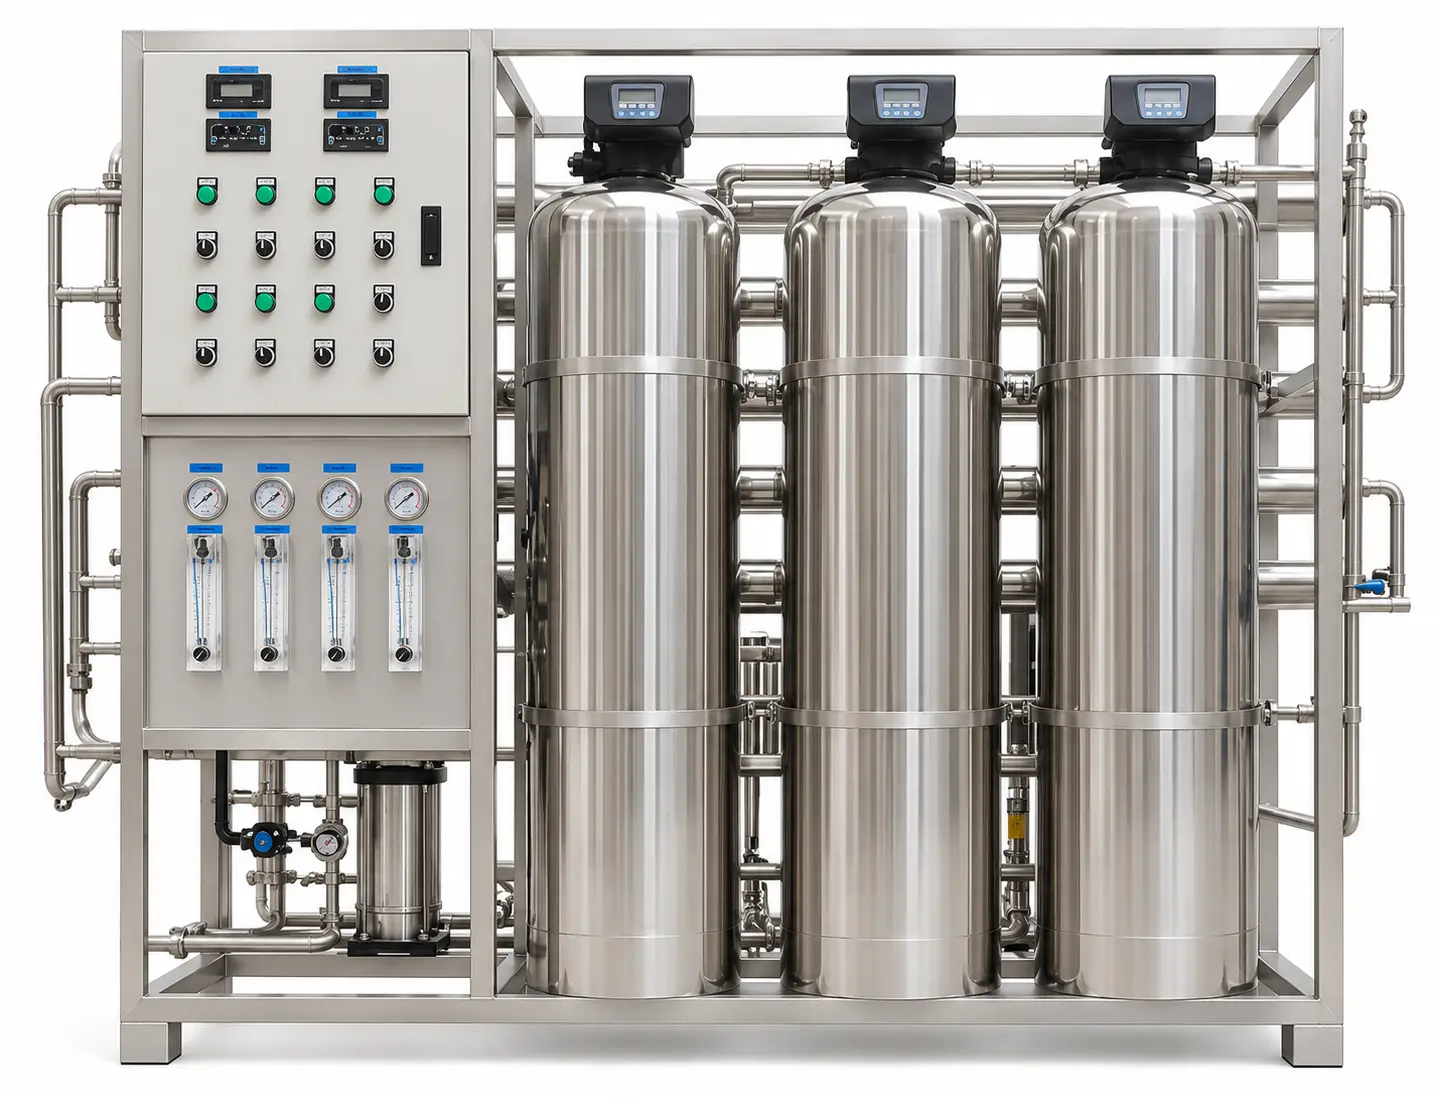
The equipment package often includes membranes, pressure vessels, a high-pressure pump, piping, instruments, and controls. However, package boundaries differ significantly between suppliers.
Ask each bidder for a detailed equipment list. The list should identify manufacturers, materials, quantities, ratings, and included spare parts.
Capacity and Design Flow
Required permeate flow determines membrane area, vessel count, pump size, and pipe diameter. Peak demand also affects storage and downstream distribution equipment.
Do not size an RO system from average demand alone. Define hourly peaks, daily production, operating hours, and planned redundancy.
An oversized unit costs more and may cycle inefficiently. An undersized unit can restrict production or require expensive overtime operation.
Feedwater Quality and Pretreatment
Feedwater quality often creates the largest hidden difference between proposals. Suspended solids, hardness, silica, iron, organics, and microbes require different controls.
Possible pretreatment includes multimedia filtration, ultrafiltration, softening, carbon, dosing, or cartridge filtration. Wastewater reuse normally needs more protection than stable municipal water.
Effective pretreatment adds capital cost but can reduce cleaning, pressure, and membrane replacement. The U.S. Department of Energy identifies pretreatment as a key recovery optimization method.
Request complete feedwater testing before final design. Seasonal or production-related variation should be included, not hidden inside a single average sample.
Recovery, Staging, and Membrane Area
Recovery equals permeate flow divided by feed flow. Higher recovery reduces feedwater and concentrate volume, but it increases dissolved concentrations inside the system.
That concentration can increase scaling and fouling risk. It may also require more stages, controls, cleaning capacity, or specialized pretreatment.
Do not choose the highest advertised recovery automatically. Compare water savings against energy, chemical, reliability, and concentrate management costs.
Materials of Construction
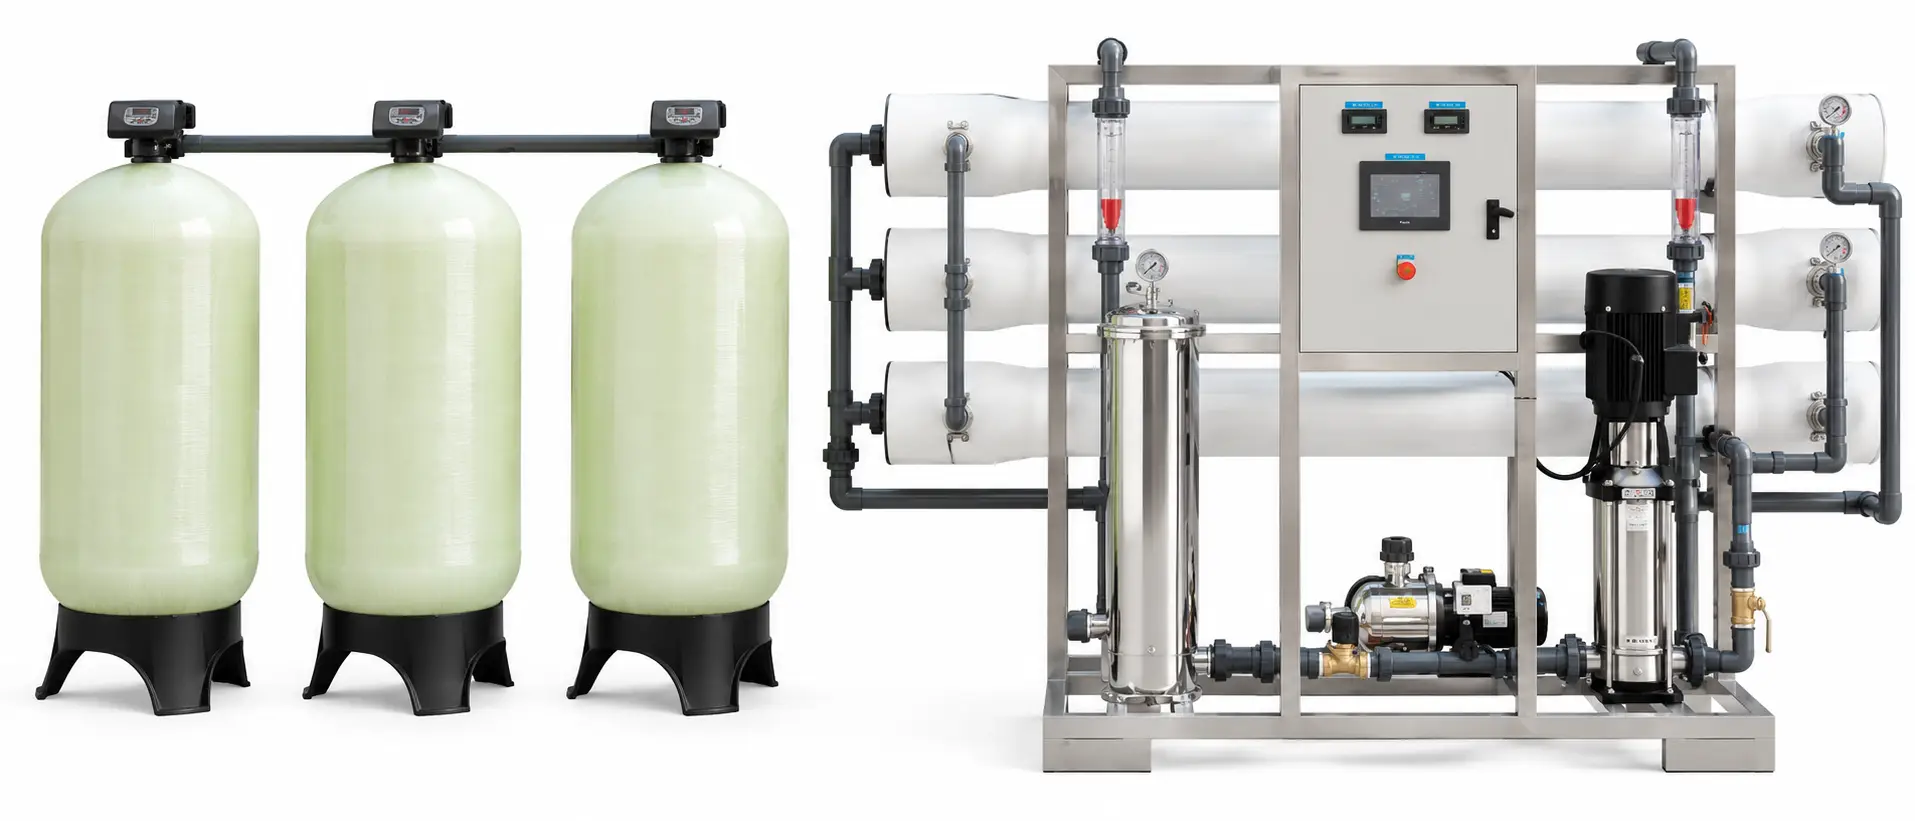
PVC and FRP can suit many standard industrial applications. Stainless steel becomes necessary when pressure, sanitation, temperature, or customer standards demand it.
Sanitary fittings, orbital welding, heat sanitization, and polished surfaces increase fabrication costs. They may be justified for pharmaceutical, food, or sensitive process applications.
Specify wetted materials and pressure ratings in your request for quotation. Otherwise, a lower bid may simply use a lower construction standard.
Automation and Redundancy
Basic systems may provide local gauges and limited automatic shutdown protection. Advanced systems can include PLC control, remote monitoring, trending, and automatic cleaning sequences.
More automation raises capital cost but can reduce operator workload and response time. The value depends on staffing, process risk, and downtime consequences.
Redundant pumps, membrane trains, instruments, and power supplies also increase equipment cost. They can protect continuous production when one component requires service.
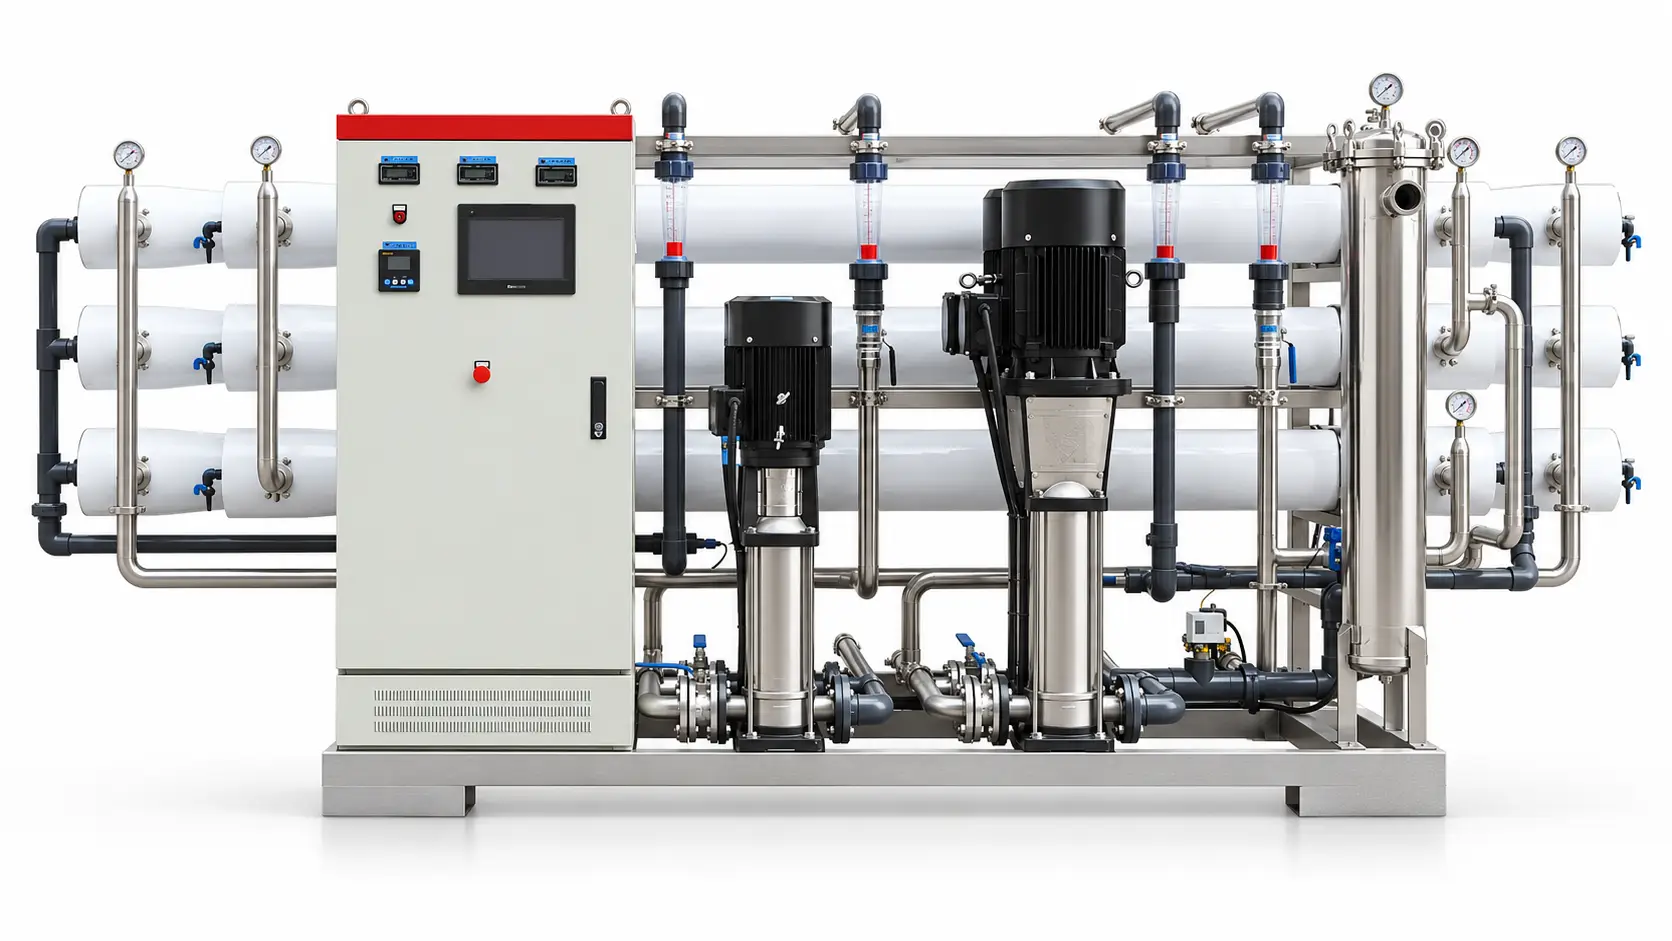
Installation and Project Costs
The skid price rarely represents the installed project cost. Site integration can add 15%–40% of total project cost in published supplier guidance.
Actual percentages depend on modularization and civil work. Remote locations, restricted access, and active production areas usually increase installation expense.
Engineering, Testing, and Permits
Engineering covers process design, layouts, foundations, electrical work, controls, and safety reviews. Complex projects may also require pilot testing or treatability studies.
Published supplier guidance places engineering near 10%–15% of total project cost. Use that range only before detailed site engineering becomes available.
Permitting may cover water abstraction, wastewater discharge, chemical storage, pressure equipment, or building modifications. Local requirements should be confirmed before purchasing equipment.
Civil, Mechanical, and Electrical Work
Site work may include foundations, drainage, ventilation, lighting, access platforms, and a treatment building. Existing facilities often need structural or utility upgrades.
Mechanical work includes feed piping, permeate piping, concentrate piping, tanks, and chemical systems. Electrical work includes power distribution, cabling, panels, and grounding.
Ask suppliers to mark every battery limit on the process drawing. Each connection should identify pressure, flow, material, size, and responsibility.
Freight, Duties, and Site Handling
Freight can become significant for containerized systems, tanks, or international projects. Published guidance commonly suggests 5%–10% of equipment cost for initial freight planning.
That allowance can change with distance, shipment dimensions, duties, and local handling. Your budget should also include cranes, storage, insurance, and inspection.
Commissioning and Performance Testing
Commissioning confirms rotation, pressure control, flow balance, alarms, interlocks, and permeate quality. It also creates the baseline for future performance normalization.
Require a written performance test and acceptance criteria. Training, manuals, spare parts, and water-analysis procedures should appear in the contract scope.
Industrial RO Operating Expenses
Annual operating cost includes much more than electricity. Feedwater, concentrate disposal, chemicals, filters, membranes, labor, and maintenance can dominate the total.
The EPA model includes labor, chemicals, materials, energy, and residuals discharge fees. Your financial model should cover the same major categories.
Electricity
High-pressure pumping usually consumes the most direct electrical energy. Required power depends on pressure, flow, pump efficiency, salinity, temperature, and system recovery.
Estimate annual energy cost with the following formula. Keep every input in consistent units.
Annual energy cost = average input power × operating hours × electricity rate
Use measured motor input power when possible. Motor nameplate power can overstate consumption, while ideal hydraulic calculations can understate it.
Low-energy membranes may reduce pressure under suitable conditions. However, final selection must still meet rejection, flux, fouling, and temperature requirements.
Feedwater and Concentrate Disposal
RO creates permeate and a concentrated reject stream. Therefore, feedwater volume always exceeds saleable or usable product water.
At 75% recovery, producing 100 m³ requires about 133 m³ of feedwater. The remaining 33 m³ requires reuse, discharge, or disposal.
Water and sewer tariffs can make recovery financially important. Disposal may cost more when concentrate contains regulated or process-derived contaminants.
Confirm discharge limits before choosing the recovery target. A technically efficient system can become uneconomic when its concentrate lacks an acceptable outlet.
Chemicals, Filters, and Membranes
Chemical costs may include antiscalant, acid, alkali, dechlorination agents, biocides, and cleaning products. Actual consumption depends on water chemistry and operating strategy.
Cartridge filters are replaced more frequently than membranes. Their cost includes elements, labor, downtime, and disposal.
Membrane life cannot be guaranteed from a generic schedule. Poor pretreatment, oxidation, scaling, or frequent cleaning can shorten service life substantially.
Budget a replacement reserve using installed element quantity and current delivered price. Update that reserve after your first year of operating data.
Labor, Monitoring, and Maintenance
Automated plants still require inspections, sampling, calibration, cleaning, reporting, and troubleshooting. Labor needs depend on system complexity and regulatory obligations.
Budget preventive maintenance for pumps, valves, instruments, dosing equipment, and cleaning systems. Include remote support and emergency service when production downtime is expensive.
Normalized flow, salt passage, pressure drop, temperature, and recovery should be trended. Early detection can prevent energy waste and irreversible membrane damage.
Example Total Cost Model for a 100 GPM System
The following example shows a budgeting method, not a supplier quotation. Replace every assumption with project-specific values before approving capital.
This scenario assumes 100 GPM permeate and 6,000 annual operating hours. It uses 75% recovery and a 30 kW average electrical load.
Illustrative Installed Capital Budget
| Capital item | Illustrative amount |
|---|---|
| RO equipment package | $250,000 |
| Pretreatment package | $90,000 |
| Storage and post-treatment | $45,000 |
| Engineering, testing, and permits | $35,000 |
| Installation and site integration | $150,000 |
| Commissioning, training, and spares | $20,000 |
| Contingency | $59,000 |
| Illustrative installed total | $649,000 |
The equipment represents less than half of this example's installed total. A skid-only comparison would therefore understate the funding requirement.
Contingency should reflect design maturity and site uncertainty. Reduce it only when surveys, testing, and installation scope are genuinely complete.
Illustrative Annual Operating Budget
| Operating item | Assumption | Annual cost |
|---|---|---|
| Electricity | 30 kW, 6,000 hours, $0.12/kWh | $21,600 |
| Feedwater | 181,680 m³ at $0.80/m³ | $145,344 |
| Concentrate discharge | 45,420 m³ at $0.50/m³ | $22,710 |
| Chemicals | Planning allowance | $12,000 |
| Cartridge filters | Planning allowance | $6,000 |
| Membrane reserve | Planning allowance | $20,000 |
| Operating labor | Planning allowance | $45,000 |
| Routine maintenance | Planning allowance | $15,000 |
| Illustrative annual total | 136,260 m³ permeate | $287,654 |
This example produces an operating cost near $2.11 per cubic meter. Financing, depreciation, taxes, and product distribution remain excluded.
Feedwater is the largest modeled expense here. Another location may show electricity, labor, or concentrate disposal as the leading cost.
How to Reduce Total Cost Without Increasing Risk
Start with reliable water analysis and a realistic demand profile. Better inputs prevent oversizing, inadequate pretreatment, and expensive redesign.
Compare lifecycle cost at the required water quality. A cheaper system may consume more energy or require more frequent membrane replacement.
Pilot difficult wastewater or variable feedwater before final procurement. Pilot results can validate flux, recovery, pretreatment, cleaning frequency, and permeate quality.
Specify efficient pumps and correctly sized motors. Variable-frequency drives can help when demand changes, but controls must preserve safe membrane flow.
Evaluate concentrate reuse before disposal. Suitable options may include cooling, washing, upstream processes, or staged recovery after additional treatment.
Do not force higher recovery beyond chemical and hydraulic limits. The resulting scaling risk may exceed any water savings.
Use normalized performance data instead of raw flow alone. Temperature changes can alter output even when membrane condition remains stable.
Finally, negotiate clear performance guarantees and scope boundaries. A complete proposal reduces change orders and makes supplier comparisons more reliable.
What Information Should You Send Suppliers?
A useful quotation starts with complete design information. Missing inputs force suppliers to add contingency or make incompatible assumptions.
Provide the following data with your request. Complete inputs improve quotation accuracy and reduce unnecessary supplier contingency.
- Full feedwater analysis, including seasonal ranges
- Required permeate flow and daily operating hours
- Product-water limits for each critical constituent
- Target recovery and available concentrate outlet
- Feed pressure, temperature range, and supply limits
- Preferred materials, automation, redundancy, and sanitation standard
- Available footprint, power, drainage, and chemical storage
- Delivery location, schedule, and installation responsibility
- Required testing, documentation, training, and spare parts
Request a guaranteed design basis with every quotation. It should state flow, recovery, rejection, temperature, pressure, and feedwater assumptions.
How to Compare Industrial RO Quotations
Build a bid comparison table before selecting a supplier. Normalize capacity, water quality, recovery, operating hours, and included equipment.
| Comparison item | What you should verify |
|---|---|
| Design basis | Feed analysis, temperature, flow, recovery, and permeate limits |
| Equipment scope | Pretreatment, RO skid, tanks, dosing, CIP, and post-treatment |
| Component quality | Brands, materials, pressure ratings, and certifications |
| Installation scope | Foundations, piping, wiring, insulation, freight, and crane work |
| Performance | Guaranteed flow, quality, recovery, energy, and test conditions |
| Operating cost | Power, chemicals, filters, membranes, labor, and disposal |
| Service support | Warranty, commissioning, training, spares, and response time |
| Exclusions | Permits, taxes, utilities, testing, buildings, and site modifications |
The lowest purchase price is not always the lowest-risk choice. Select the proposal delivering acceptable lifecycle cost under your actual operating conditions.
FAQ
1. What is the average cost of an industrial RO system?
There is no reliable average without capacity, feedwater, and product-quality requirements. Published examples range from about $45,000 to several million dollars.
Use those figures for screening only. A project-specific quotation should follow water analysis, site review, and a written design basis.
2. How much does industrial RO installation cost?
Published supplier guidance places installation near 15%–40% of total project cost. Civil work and site integration can move that percentage significantly.
Request separate prices for mechanical, electrical, civil, commissioning, and freight work. This separation exposes exclusions and reduces later change orders.
3. What is the largest industrial RO operating expense?
The largest expense depends on local conditions. Feedwater dominated our example, while other sites may face higher energy or disposal costs.
Model every cost using local tariffs and expected consumption. Do not apply another plant's cost percentages without checking its design basis.
4. How can we calculate RO operating cost per cubic meter?
Add annual energy, water, discharge, chemical, filter, membrane, labor, and maintenance costs. Divide that total by annual compliant permeate production.
Use net delivered water after downtime and rejected production. That denominator gives a more realistic business cost.
5. Does higher recovery always reduce total operating cost?
No. Higher recovery saves feedwater and reduces concentrate volume, but it can increase scaling, pressure, chemicals, and cleaning.
Choose recovery through water analysis and membrane modeling. The best target minimizes total cost while protecting reliability and product quality.
6. How often should industrial RO membranes be replaced?
Replacement timing depends on pretreatment, chemistry, flux, cleaning, oxidation, and operating control. A fixed universal interval can misstate your budget.
Track normalized performance and membrane condition. Maintain an annual reserve, then update it using your plant's replacement history.
7. What should an industrial RO quotation include?
It should include the design basis, equipment list, materials, guarantees, controls, documentation, commissioning, and exclusions. Operating assumptions should also be stated.
Ask for annual consumables and utility estimates. These details let you compare lifecycle value instead of only equipment price.
8. Is a turnkey RO system more economical than separate contracts?
A turnkey package can reduce interface risk and shorten installation. Separate contracts may offer flexibility when your plant has strong engineering resources.
Compare both options using identical scope and risk allocation. Include internal coordination time, schedule exposure, and warranty responsibility.