
A reliable industrial reverse osmosis water treatment system depends on more than the RO membranes. Every stage—from raw water storage and pretreatment to high-pressure pumping, membrane separation and CIP cleaning—must be designed around measurable operating parameters.
This guide explains the function of each process stage, provides typical engineering reference values, and shows which operating changes should trigger inspection, backwashing, cartridge replacement or membrane cleaning.
Typical Industrial RO Process Flow
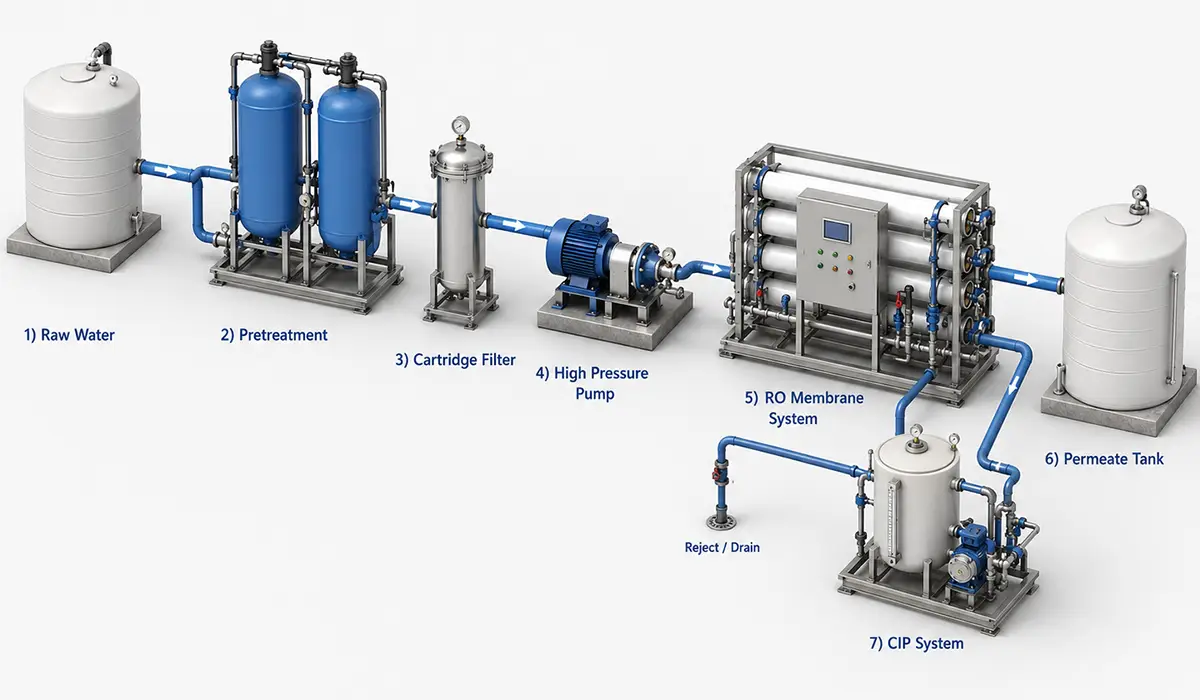
Raw Water Tank → Pretreatment → Cartridge Filter → High-Pressure Pump → RO Membrane System → Permeate Tank
Supporting sections normally include:
- Chemical dosing
- Concentrate discharge
- Automatic controls
- Instrumentation
- CIP membrane cleaning system
1. Raw Water Tank
Function of the Raw Water Tank
The raw water tank balances variations in incoming flow and provides a stable water supply to the pretreatment system.
Without sufficient buffer capacity, the feed pump and RO system may start and stop frequently, causing pressure fluctuations, higher equipment wear and unstable permeate production.
Typical Design Reference Values
| Design Item | Typical Reference Value |
|---|---|
| Minimum buffer time | 15–30 minutes |
| Recommended buffer time for unstable supply | 30–60 minutes |
| High-level reserve | Approximately 10%–15% of tank volume |
| Low-level unusable volume | Approximately 10%–15% |
| Maximum normal tank level | Usually 80%–90% of total volume |
| Recommended pump starts | Preferably fewer than 6 times per hour |
| Tank cleaning interval | Typically every 3–6 months |
| Inspection frequency | Daily visual inspection |
Example
For a pretreatment feed flow of 20 m³/h:
- 30-minute buffer volume:
20 × 0.5 = 10 m³ - After allowing for high- and low-level reserve, the selected tank may be approximately:
12–15 m³
This is only a preliminary sizing method. The actual tank volume should also consider water supply interruptions and downstream peak demand.
Design Priorities
The tank should include:
- High-, low- and very-low-level switches
- Overflow connection
- Bottom drain
- Ventilation opening
- Manhole
- Sampling point
- Anti-vortex suction arrangement
- Low-level pump interlock
The raw water pump should stop automatically at the very-low level to prevent dry running.
Daily Maintenance Limits
Operators should investigate when:
- The pump starts more than approximately 6–10 times per hour
- The tank level falls below the pump’s safe suction level
- Visible sediment exceeds approximately 50–100 mm
- Algae, odor or biofilm appears
- Level sensor readings differ from the actual water level
- Pump suction pressure becomes unstable
2. Pretreatment System
The pretreatment system should produce water that is suitable for the RO membranes, not simply water that looks clear.
For most conventional polyamide RO membrane systems, important feed-water targets at the membrane inlet include:
| Parameter | Recommended Target | Maximum Reference Limit |
|---|---|---|
| Turbidity | Below 0.5 NTU | Preferably below 1.0 NTU |
| SDI15 | Below 3 | Less than 5 |
| Free chlorine | Non-detectable | 0 mg/L target |
| Oil and grease | As low as possible | Around 0.1 mg/L maximum |
| Total iron | Below 0.05 mg/L preferred | Project-specific |
| Aluminum | Below 0.05 mg/L | 0.05 mg/L recommended maximum |
| Feed temperature | Commonly 15–35°C | Usually below 45°C |
| Continuous operating pH | Commonly 5–9 | Often 2–11 depending on membrane |
| Colloidal sulfur | None | Not permitted |
DuPont specifies an RO feed SDI below 5, no oxidizing agents in the feed, and a general feed-temperature limit below 45°C unless the membrane datasheet states otherwise. It also recommends keeping aluminum below 0.05 mg/L because aluminum can contribute to fouling and silica precipitation.
2.1 Multimedia Filter
Function
A multimedia filter removes:
- Suspended solids
- Rust
- Silt
- Turbidity
- Larger colloidal particles
It normally contains graded anthracite, quartz sand and supporting gravel.
Typical Design Values
| Design Item | Typical Range |
|---|---|
| Normal filtration velocity | 8–12 m/h |
| Conservative velocity for surface water | 6–10 m/h |
| Maximum short-term velocity | Approximately 12–15 m/h |
| Media bed depth | 800–1,200 mm |
| Freeboard above media | 40%–50% of media depth |
| Backwash velocity | Approximately 25–40 m/h |
| Backwash duration | 8–15 minutes |
| Fast rinse duration | 3–10 minutes |
| Recommended bed expansion | 20%–40% |
| Clean filter pressure drop | Usually 0.1–0.3 bar |
| Backwash trigger | Increase of approximately 0.5–0.7 bar |
| Outlet turbidity target | Below 0.5–1.0 NTU |
Actual backwash flow depends on media size, density and water temperature. Colder water is more viscous and may require adjustment.
Sizing Example
For a feed flow of 20 m³/h and a selected filtration velocity of 10 m/h:
$$ Filter\ Area = \frac{20}{10} = 2.0\ m^2 $$
Equivalent vessel diameter:
$$ D = \sqrt{\frac{4A}{\pi}} $$
$$ D = \sqrt{\frac{4 \times 2.0}{3.1416}} \approx 1.60\ m $$
A practical design may therefore select one approximately 1.6 m diameter filter, or two smaller filters for redundancy.
Maintenance Triggers
Backwash the multimedia filter when any of the following occurs:
- Differential pressure increases by 0.5–0.7 bar
- Outlet turbidity exceeds 0.5–1.0 NTU
- SDI begins to increase
- Design operating time is reached, commonly 12–24 hours
- Flow decreases by approximately 10%–20%
After backwashing, rinse to drain until outlet turbidity returns close to the clean-water baseline.
Design Warning
Do not size only for service flow. The water source and drain must also be able to provide and receive the full backwash flow.
For example, a 2 m² filter backwashed at 30 m/h requires:
$$ 2\times30=60\ m³/h $$
If the backwash pump can only provide 30 m³/h, the filter bed may not expand sufficiently and accumulated solids will remain inside the vessel.
2.2 Activated Carbon Filter
Function
The activated carbon filter removes or reduces:
- Free chlorine
- Residual oxidants
- Odor
- Some organic compounds
- Color-producing substances
This stage is particularly important because thin-film polyamide RO membranes have limited resistance to continuous oxidant exposure.
Typical Design Values
| Design Item | Typical Range |
|---|---|
| Service velocity | Approximately 5–10 m/h |
| Empty-bed contact time | 5–10 minutes |
| Minimum contact time for some applications | Approximately 3 minutes |
| Carbon bed depth | 800–1,500 mm |
| Freeboard | At least 40%–50% of bed depth |
| Backwash bed expansion | 30%–40% |
| Backwash frequency | Commonly every 1–7 days |
| Outlet free chlorine target | 0 mg/L or non-detectable |
| Practical alarm value | Around 0.02–0.05 mg/L |
| Carbon replacement interval | Often 12–24 months |
Clack’s activated carbon data gives a minimum empty-bed contact time of about 3 minutes for one catalytic-carbon product, a service rate near 5 gpm/ft² and 30%–40% backwash expansion. Actual industrial RO design should be based on chlorine loading and required contact time rather than copying a single media value.
Contact-Time Calculation
For a system flow of 20 m³/h and a required empty-bed contact time of 8 minutes:
$$ Carbon\ Bed\ Volume=20\times\frac{8}{60}=2.67\ m³ $$
If the vessel cross-sectional area is 2.0 m²:
$$ Bed\ Depth=\frac{2.67}{2.0}=1.34\ m $$
The required carbon bed depth would therefore be approximately 1.3–1.4 m.
Maintenance Triggers
Take action when:
- Outlet free chlorine reaches 0.02–0.05 mg/L
- Differential pressure increases by 0.5–0.7 bar
- Carbon fines appear downstream
- Outlet odor or organic content increases
- Cartridge filters clog unusually quickly
- Biological slime appears inside the vessel or downstream pipework
Activated carbon replacement should be based on chlorine breakthrough and adsorption performance. A fixed replacement period alone is not sufficient.
Important Design Alternative
For large industrial RO systems, chemical dechlorination using sodium metabisulfite may be more controllable than activated carbon.
A commonly referenced sodium bisulfite dosage is approximately 1.8–3.0 mg/L per 1 mg/L of free chlorine, but the actual dosage should include reaction, purity and safety factors and must be verified by residual chlorine or ORP measurement.
2.3 Water Softener
Function
The softener removes calcium and magnesium hardness before the RO system.
It is often used when:
- Feed-water hardness is high
- RO recovery is relatively high
- Antiscalant alone is not preferred
- Boiler or process-water applications require very low hardness
Typical Design Values
| Design Item | Typical Range |
|---|---|
| Service velocity | 15–30 bed volumes per hour |
| Conservative industrial design | 10–20 BV/h |
| Resin bed depth | 800–1,200 mm |
| Freeboard | 40%–70% |
| Outlet hardness target | Below 1 mg/L as CaCO₃ |
| More practical alarm point | 1–5 mg/L as CaCO₃ |
| Salt dosage | Approximately 100–160 g NaCl/L resin per regeneration |
| Brine concentration | Commonly 8%–12% |
| Slow rinse | Approximately 30–60 minutes |
| Fast rinse | Until outlet hardness and chloride stabilize |
“BV/h” means bed volumes per hour. A 2 m³ resin bed operating at 20 BV/h would have a service flow of:
$$ 2\times20=40\ m³/h $$
Capacity Calculation
Assume:
- Feed hardness: 250 mg/L as CaCO₃
- Flow: 20 m³/h
- Operating time: 20 hours
- Water volume per cycle: 400 m³
Hardness loading:
$$
250\ mg/L\times400\ m³=100\ kg\ as\ CaCO₃ $$
The resin volume should be selected according to its usable working exchange capacity, regeneration efficiency and safety factor.
Maintenance Triggers
Regenerate or inspect the softener when:
- Outlet hardness exceeds 1–5 mg/L as CaCO₃
- Salt level is below the minimum brine-making requirement
- Brine is not being drawn during regeneration
- Pressure drop rises more than approximately 0.5 bar
- Resin appears broken, fouled or lost
- Regeneration water consumption increases unexpectedly
For continuous industrial operation, a duplex alternating softener is usually preferable so that one vessel remains in service while the other regenerates.
2.4 Antiscalant Dosing
Function
Antiscalant reduces the precipitation risk of salts such as:
- Calcium carbonate
- Calcium sulfate
- Barium sulfate
- Strontium sulfate
- Calcium fluoride
- Silica-related scale
Typical Design Values
| Item | Typical Reference |
|---|---|
| Common antiscalant dosage | 2–5 mg/L |
| Wider application range | Approximately 1–8 mg/L |
| Dosing concentration | According to supplier’s dilution limit |
| Dosing accuracy | Preferably within ±5%–10% |
| Chemical tank reserve | Normally at least 24 hours |
| Dosing pump configuration | Duty plus standby recommended |
| Injection point | Upstream of cartridge filter with proper mixing |
The dosage should never be selected only as “3 ppm by experience.” It should be calculated from the full feed-water analysis and RO recovery.
Dosing Calculation
For a feed flow of 20 m³/h and an antiscalant dosage of 3 mg/L:
$$ 20,000\ L/h\times3\ mg/L=60,000\ mg/h=60\ g/h $$
Daily pure product consumption:
$$ 60\times24=1.44\ kg/day $$
If a 10% diluted solution is used:
$$ \frac{1.44}{10%}=14.4\ kg/day $$
The dosing pump should therefore deliver approximately 0.6 kg/h of diluted solution, subject to solution density.
Maintenance Triggers
Stop or protect the RO system when:
- Chemical tank reaches low-low level
- Dosing pump loses stroke or flow
- Injection pipe is blocked
- Actual chemical consumption differs from calculation by more than approximately 10%–15%
- Concentrate scaling index exceeds the approved design
- Conductivity or flow changes but dosage is not recalculated
Silica and metal interactions require particular care. DuPont notes that iron and aluminum should each be kept below approximately 0.05 mg/L where silica fouling is a concern, and gives a reference limit of less than 150 mg/L brine-soluble silica at 25°C under specified operating conditions.
3. Cartridge Filter
Function
The cartridge filter is the final particle barrier before the high-pressure pump and RO membranes.
It protects the RO system against:
- Filter-media carryover
- Pipe rust
- Chemical precipitates
- Fine suspended solids
- Accidental pretreatment breakthrough
Typical Design Values
| Design Item | Typical Range |
|---|---|
| Common nominal rating | 5 µm |
| Higher-risk feed water | 1–5 µm |
| Clean differential pressure | Approximately 0.05–0.2 bar |
| Replacement differential pressure | Commonly 0.7–1.0 bar |
| Maximum recommended velocity | Follow cartridge manufacturer |
| Housing design pressure | Above maximum pump suction pressure |
| Replacement interval | Often 1–8 weeks |
| Typical target life | At least 4 weeks under stable conditions |
DuPont notes that typical 5 µm cartridges will not reliably remove all submicron metallic sulfides or colloidal sulfur, so cartridge filtration cannot compensate for inadequate pretreatment.
Maintenance Interpretation
| Observation | Likely Meaning |
|---|---|
| Cartridges last less than 7 days | Serious upstream pretreatment problem |
| Cartridges last 1–2 weeks | Pretreatment requires review |
| Cartridges last 4–8 weeks | Generally more acceptable |
| Differential pressure rises suddenly | Pretreatment breakthrough or precipitation |
| Black deposits | Carbon fines, manganese or biological material |
| Reddish-brown deposits | Iron corrosion or iron oxidation |
| White crystalline deposits | Mineral precipitation or chemical incompatibility |
Replacement Trigger
Replace cartridges when:
- Differential pressure reaches 0.7–1.0 bar
- Feed flow decreases by approximately 10%
- High-pressure pump suction pressure becomes unstable
- Cartridges become deformed or collapsed
- Outlet particle level or SDI increases
The actual maximum differential pressure must follow the cartridge and housing manufacturer’s rating.
4. High-Pressure Pump
Function
The high-pressure pump provides sufficient pressure to overcome:
- Feed-water osmotic pressure
- Membrane resistance
- Pressure loss through piping
- Pressure loss through membrane feed spacers
Typical Operating Pressures
| RO Application | Typical Feed Pressure |
|---|---|
| Tap-water RO | Approximately 5–10 bar |
| Low-salinity brackish water | Approximately 8–12 bar |
| Typical brackish-water RO | Approximately 10–20 bar |
| Higher-salinity brackish water | Approximately 15–30 bar |
| Seawater RO | Approximately 50–70 bar |
| High-recovery concentrate treatment | May exceed these ranges |
These are broad operating references, not pump-selection values. Final pressure must be obtained from membrane projection software under minimum water temperature and end-of-run fouling conditions.
Pump Selection Allowances
| Design Item | Typical Reference |
|---|---|
| Pump flow allowance | Approximately 5% above design flow |
| Pressure allowance | Commonly 10%–15% |
| Preferred operating point | Near best-efficiency point |
| Motor power reserve | Commonly 10%–15% |
| Minimum suction margin | Meet pump NPSH requirement with safety allowance |
| VFD startup ramp | Commonly 30–60 seconds |
| Pressure-rise limit | Avoid abrupt pressurization |
| Normal vibration | Compare against pump baseline and manufacturer limit |
DuPont recommends initially flushing membrane vessels at approximately 2–4 bar before applying full operating pressure, with feed and concentrate valves open, to remove air and reduce hydraulic shock.
Daily Maintenance Triggers
Investigate when:
- Discharge pressure rises more than 10%–15% at the same normalized production
- Motor current increases more than approximately 10%
- Suction pressure drops below the pump’s minimum requirement
- Vibration rises noticeably above commissioning baseline
- Bearing temperature rises more than approximately 10–15°C above normal
- Mechanical seal leakage becomes continuous
- Cavitation noise appears
Do not increase pump pressure simply to compensate for declining membrane flow without first checking water temperature, cartridge differential pressure, membrane fouling and concentrate flow.
5. RO Membrane System
5.1 Feed-Water Quality Targets
| Feed Parameter | Preferred Design Target |
|---|---|
| SDI15 | Below 3 |
| Maximum SDI15 | Below 5 |
| Turbidity | Below 0.5 NTU preferred |
| Free chlorine | 0 mg/L |
| Oil and grease | Below 0.1 mg/L |
| Aluminum | Below 0.05 mg/L |
| Iron | Below 0.05 mg/L preferred |
| Feed temperature | Normally 15–35°C |
| Continuous pH | Commonly 5–9, membrane-dependent |
| Maximum general temperature | Usually 45°C |
| Colloidal sulfur | None |
The official operating limit must come from the selected membrane model’s datasheet. Some specialty elements have different pH, temperature and chlorine tolerances.
5.2 Typical System Recovery
$$ Recovery = \frac{Permeate\ Flow}{Feed\ Flow} \times 100\% $$
| Feed-Water Type | Typical System Recovery |
|---|---|
| Tap water | 70%–85% |
| Groundwater | 70%–80% |
| Brackish water | 65%–80% |
| Surface water | 65%–75% |
| Treated wastewater | 60%–75% |
| Seawater | 35%–50% |
| Small single-element system | Often lower |
Example
Feed flow:
$$ 20\ \mathrm{m^3/h} $$
Permeate flow:
$$ 15\ \mathrm{m^3/h} $$
Recovery:
$$ \frac{15}{20} \times 100\% = 75\% $$
Concentrate flow:
$$ 20 - 15 = 5\ \mathrm{m^3/h} $$
The concentration factor, under a simplified assumption of complete rejection, is approximately:
$$ CF = \frac{1}{1-Recovery} $$
At 75% recovery:
$$ CF = \frac{1}{1-0.75} = 4 $$
This means salts in the tail-end concentrate may approach approximately four times the feed concentration before accounting for salt passage and other effects.
5.3 Typical Membrane Flux
$$ Flux=\frac{Permeate\ Flow}{Membrane\ Area} $$
| Feed Type | Typical Average Design Flux |
|---|---|
| RO permeate second pass | 25–35 LMH |
| Clean well water | 18–25 LMH |
| Municipal water | 16–22 LMH |
| Surface water | 12–18 LMH |
| Treated wastewater | 10–16 LMH |
| Seawater | 11–16 LMH |
LMH means litres per square metre per hour.
The more difficult the feed water, the lower the design flux should generally be.
DuPont’s 8-inch design guidance uses different maximum permeate flows and element recovery limits according to feed source and pretreatment quality. For example, better pretreatment and lower SDI allow higher element loading, while conventional pretreatment of wastewater or open-intake seawater requires more conservative design.
Membrane Quantity Example
Required permeate:
$$ 15 m³/h=15,000 L/h $$
Selected average flux:
$$ 18 LMH $$
Required membrane area:
$$ frac{15,000}{18}=833\ m² $$
If each 8-inch element has approximately 37 m² of active membrane area:
$$ \frac{833}{37}\approx22.5 $$
The preliminary requirement would be approximately 23–24 membrane elements, followed by array and element-recovery checks using membrane-design software.
5.4 Salt Rejection
$$ Salt\ Rejection=\left(1-\frac{Permeate\ Conductivity}{Feed\ Conductivity}\right)\times100% $$
Example:
- Feed conductivity: 2,000 µS/cm
- Permeate conductivity: 40 µS/cm
$$ Rejection=\left(1-\frac{40}{2000}\right)\times100%=98% $$
Typical stabilized rejection for industrial brackish-water RO membranes may be around 98%–99.7%, depending on membrane model and operating conditions.
Do not compare the operating result directly with the datasheet rejection unless test conditions are comparable.
5.5 Pressure Drop
Pressure drop should be recorded for each RO stage.
| Monitoring Item | Typical Action Point |
|---|---|
| Increase in stage pressure drop | Approximately 15% above normalized baseline |
| Increase in total system pressure drop | Approximately 15% |
| Sudden increase | Immediate inspection |
| Uneven rise in first stage | Possible particulate or biofouling |
| Larger rise in final stage | Possible scaling |
Absolute allowable pressure drop depends on element model, vessel element count and membrane manufacturer limits.
5.6 When to Clean RO Membranes
CIP cleaning should normally be initiated when one or more normalized parameters change by approximately:
| Parameter | Cleaning Trigger |
|---|---|
| Normalized permeate flow | Decrease of 10% |
| Normalized salt rejection | Decrease corresponding to 5%–10% rise in salt passage |
| Normalized feed pressure | Increase of 10%–15% |
| Stage differential pressure | Increase of 15% |
| Product-water conductivity | Sustained rise after correction for feed conductivity and temperature |
DuPont states that cleaning procedures should be applied when normalized membrane flow declines by approximately 10%.
Do not wait until performance has declined by 25%–30%. Heavy deposits are more difficult to remove and may cause irreversible membrane damage.
6. Permeate Tank
Function
The permeate tank balances RO production and downstream water demand.
Typical Design Values
| Design Item | Typical Reference |
|---|---|
| Buffer time | 30–60 minutes |
| Highly variable downstream demand | 1–2 hours |
| High-level setting | Approximately 80%–90% |
| Low-level setting | Approximately 20%–30% |
| Minimum reserve | Based on downstream critical demand |
| Tank cleaning interval | Commonly every 3–6 months |
| High-purity loop turnover | Often designed for continuous recirculation |
Sizing Example
For an RO permeate flow of 15 m³/h and a 1-hour buffer:
$$ 15 times1=15 m³ $$
After considering unusable volume and level-control spacing, the selected tank might be approximately 18–20 m³.
Permeate Backpressure
RO permeate piping must not create excessive backpressure.
DuPont lists a maximum reverse differential, where permeate static pressure exceeds reject-side static pressure, of approximately 5 psi or 0.34 bar for the referenced operating conditions.
Install:
- Check valves
- Proper tank elevation
- Permeate-pressure monitoring
- Air break where chlorinated product water could flow back toward the membranes
7. Concentrate or Reject Line
Function
The concentrate line removes the dissolved salts and contaminants rejected by the RO membranes.
Key Operating Values
| Item | Typical Control Requirement |
|---|---|
| Concentrate flow | Maintain design value |
| Recovery deviation | Preferably within ±2%–3% |
| Conductivity | Normally higher than feed water |
| Flow alarm | Commonly at 10% below design |
| Sampling frequency | Daily or continuously monitored |
| Valve position | Locked or controlled after commissioning |
Example
At:
- Feed flow: 20 m³/h
- Recovery: 75%
Required concentrate flow:
$$ 20\times(1-0.75)=5\ m³/h $$
If the concentrate flow falls to 3 m³/h while permeate remains 15 m³/h:
$$ Recovery=\frac{15}{15+3}\times100%=83.3% $$
This seemingly small flow change raises the concentration factor from 4 to approximately:
$$ \frac{1}{1-0.833}=6 $$
Scaling risk may therefore increase significantly.
Maintenance Triggers
Inspect immediately when:
- Concentrate flow decreases by more than 10%
- Recovery rises more than 2–3 percentage points
- Concentrate valve position changes without authorization
- Tail-stage pressure drop increases
- Scale particles appear
- Concentrate pipe vibration or blockage develops
8. CIP Cleaning System
Typical CIP Design Values for 8-Inch Membrane Elements
| Item | Typical Reference Range |
|---|---|
| Cleaning pressure | Usually 1.5–4 bar |
| Cleaning flow per pressure vessel | Approximately 6–10 m³/h |
| Cleaning temperature | Commonly 25–35°C |
| Maximum cleaning temperature | Membrane- and pH-dependent |
| Low-flow displacement time | 10–20 minutes |
| Recirculation time | 30–60 minutes |
| Soaking time | 1–4 hours where required |
| Final flush | Until pH and conductivity stabilize |
| Permeate diversion after cleaning | At least 30 minutes or until clear |
| Cleaning tank volume | Sufficient to fill piping, vessels and maintain pump suction |
DuPont recommends flushing with good-quality chlorine-free water after cleaning, preferably at a temperature of at least 20°C, and sending initial permeate to drain for at least 30 minutes or until it is clear.
Approximate Cleaning pH
| Fouling Type | Typical Cleaning Approach |
|---|---|
| Carbonate scale | Acidic cleaning, often pH 2–3 |
| Metal oxides | Acidic cleaning with suitable chelant |
| Organic fouling | Alkaline cleaning, often pH 10–12 |
| Biological fouling | Alkaline cleaning plus approved biocide where compatible |
| Silica fouling | Specialized high-pH procedure, membrane-dependent |
DuPont gives a broad general membrane operating range of pH 2–11 for continuous operation and pH 1–13 during cleaning for applicable elements, but temperature limits become more restrictive at extreme pH. The selected membrane datasheet and cleaning table must always take priority.
CIP Flow Calculation
If one stage contains six pressure vessels and the selected cleaning flow is 8 m³/h per vessel:
$$ 6\times8=48\ m³/h $$
The CIP pump must provide approximately 48 m³/h at low pressure, plus piping-loss allowance.
Cleaning one vessel at a time with an undersized pump may produce insufficient crossflow and poor removal of deposits.
9. Recommended Instrumentation and Alarm Setpoints
A complete industrial RO system should include more than one pressure gauge and one conductivity meter.
| Instrument | Recommended Location | Typical Alarm Logic |
|---|---|---|
| Level transmitter | Raw water tank | Low and low-low |
| Pressure gauge | Before and after multimedia filter | High differential pressure |
| Chlorine analyzer | After carbon/dechlorination | Above 0.02–0.05 mg/L |
| SDI test point | Before RO | Above 3 warning; above 5 shutdown/review |
| Pressure gauge | Before and after cartridge filter | ΔP above 0.7–1.0 bar |
| Low-pressure switch | High-pressure pump suction | Below safe pump requirement |
| Pressure transmitter | RO feed | High and low pressure |
| Flow meter | Feed | ±5%–10% from design |
| Flow meter | Permeate | 10% normalized decline |
| Flow meter | Concentrate | 10% below design |
| Conductivity meter | Feed and permeate | Rejection decline |
| pH meter | RO feed | Outside design range |
| Temperature sensor | RO feed | Used for normalization |
| Differential pressure | Each RO stage | 15% increase |
| Chemical level switch | Dosing tanks | Low and low-low |
10. Recommended Daily Operating Record
The operator should record at least the following once per shift:
| Parameter | Normal Comparison Method |
|---|---|
| Raw water level | Compare with operating range |
| Feed-water turbidity | Target below 0.5–1.0 NTU |
| SDI15 | Target below 3 |
| Residual chlorine | 0 mg/L target |
| Cartridge-filter differential pressure | Replace near 0.7–1.0 bar |
| RO feed pressure | Compare normalized baseline |
| First-stage differential pressure | Alarm at approximately 15% increase |
| Second-stage differential pressure | Alarm at approximately 15% increase |
| Feed flow | Within approximately ±5% |
| Permeate flow | Normalize for temperature and pressure |
| Concentrate flow | Within approximately ±5%–10% |
| Recovery | Within approximately ±2%–3% |
| Feed conductivity | Record trend |
| Permeate conductivity | Calculate salt rejection |
| Feed pH | Within design range |
| Feed temperature | Required for normalization |
| Antiscalant consumption | Compare theoretical dosage |
| Pump current | Compare commissioning baseline |
11. Quick Troubleshooting Table with Numerical Triggers
| Problem | Numerical Indication | Likely Cause |
|---|---|---|
| Cartridge blockage | ΔP reaches 0.7–1.0 bar | Pretreatment breakthrough |
| Membrane particulate fouling | First-stage ΔP rises 15% | High SDI or suspended solids |
| Membrane scaling | Tail-stage ΔP rises 15% | Excessive recovery or dosing failure |
| Organic or biological fouling | Flow falls 10%, pressure rises | TOC, biofilm or poor disinfection |
| Membrane damage | Permeate conductivity rises sharply | Oxidation, O-ring leak or mechanical damage |
| Excessive recovery | Recovery rises 2–3 percentage points | Concentrate valve or flow problem |
| Pump problem | Current or vibration rises approximately 10% | Cavitation, bearing or hydraulic issue |
| Carbon exhaustion | Chlorine reaches 0.02–0.05 mg/L | Carbon breakthrough |
| Softener exhaustion | Hardness above 1–5 mg/L as CaCO₃ | Regeneration or resin problem |
| Antiscalant dosing failure | Consumption differs over 10%–15% | Pump calibration or blockage |
Important Note for Readers
These figures are typical engineering reference ranges, not universal acceptance limits.
The final design should be based on:
- Complete feed-water analysis
- Minimum and maximum water temperature
- Selected RO membrane model
- Membrane projection software
- Required permeate quality
- Target recovery
- Local discharge requirements
- Chemical supplier recommendations
- Applicable pressure-vessel and electrical standards
For high-silica water, seawater, landfill leachate, industrial wastewater or high-recovery RO systems, standard reference ranges may not be conservative enough.